Most Auckland landlords track the wrong numbers. They celebrate being “cashflow positive” by $50 per week while ignoring a $15,000 maintenance backlog. They focus on rental yield while their tenant turnover rate quietly destroys returns. They round expenses to the nearest hundred and wonder why their spreadsheet never matches their bank account.
If you inherited a rental property, upgraded homes and kept the old place, or bought an investment property in the last decade, you probably measure success the same way everyone else does: “Am I cashflow positive?”
That’s not the question.
The real question is: “Is this asset performing?” And to answer that, you need to track the metrics that actually predict long-term returns. Not the Instagram-friendly numbers that look good in a screenshot.
This article breaks down the six metrics that serious Auckland landlords use to evaluate property performance in 2026, why gross yield is misleading, and how to calculate the numbers that determine whether your $850,000 Silverdale townhouse is genuinely building wealth or slowly eroding it.
Quick Answer: Track six metrics instead of one. Net yield (after all costs including CapEx), tenant retention rate, lifecycle cost ratio, compliance risk score, 10-year IRR, and actual cashflow (not “positive” or “negative” but the real number after tax and principal repayment). Most Auckland landlords focus on gross yield and wonder why their “performing” property requires constant capital injections.
Why Most Property “Performance” Metrics Are Useless
Walk into any Auckland property investment seminar and you’ll hear the same advice: “Find a property with at least 5% gross yield.” Or “Make sure it’s cashflow positive from day one.” Or “Target 7% returns.”
These sound authoritative. They’re specific numbers. They’re easy to calculate. They’re also dangerously incomplete.
The problem isn’t that these metrics are wrong. It’s that they measure the wrong things. Gross yield tells you what the property earns, but not what it costs. Cashflow positive sounds good until you realise you’re ignoring principal repayment. A “7% return” means nothing without specifying whether that’s pre-tax, post-leverage, or including capital appreciation.
The Real Cost of Bad Metrics
Consider a typical Auckland scenario. You buy a property in 2020 for $750,000. In 2026, it’s worth $850,000. You calculate your return: $100,000 capital gain divided by $750,000 purchase price equals 13.3% over six years. Looks great, right?
Wrong. You forgot:
- $45,000 in mortgage interest you couldn’t deduct (pre-2021 interest deductibility rules)
- $12,000 in maintenance and repairs
- $8,500 in property management fees
- $7,200 in rates increases over six years
- $4,800 in insurance premium increases
- Three weeks of vacancy (lost rent: $2,550)
- Letting fees for two tenant changes ($1,300)
Your actual net position after all costs? $18,650 gain over six years. That’s 2.5% total return, or 0.4% annually. Less than a term deposit. On a leveraged asset that could have bankrupted you if the market moved 10% the wrong way.
This isn’t theoretical. It’s happening to Auckland landlords right now. They think they’re building wealth because the headline number looks good. The actual performance tells a different story.
Metric 1: Net Yield (Not Gross Yield)
Everyone knows gross yield. It’s the easy number: annual rent divided by property value. A $650 per week property worth $850,000 has a gross yield of 3.98%.
Useless.
Gross yield ignores every single cost of ownership. Rates, insurance, maintenance markups, letting fees, vacancy, compliance costs. All invisible. This is like evaluating a business on revenue without looking at expenses.
Net Yield: The Actual Number
Net yield is what’s left after all operating expenses and capital expenditure. This is the number that determines whether your property is genuinely generating income or slowly consuming it.
Formula:
Net Yield = (Annual Rent – All OpEx – Annualised CapEx) / Property Value × 100
Example Calculation for an $850,000 Auckland Property:
Annual Rent Collected: $33,800 ($650/week)
Operating Expenses:
- Rates: $3,200
- Insurance: $1,800
- Property management (8.5%): $2,873
- Inspection fees (4 × $50): $200
- Letting fee (amortised over 2 years): $325
- Maintenance (annual average): $1,200
- Total OpEx: $9,598
Capital Expenditure (Annualised):
- Carpet replacement (every 10 years): $3,500 ÷ 10 = $350
- Exterior paint (every 10 years): $8,000 ÷ 10 = $800
- Hot water cylinder (every 12 years): $2,400 ÷ 12 = $200
- Heat pump service/replacement reserve: $250
- Total Annualised CapEx: $1,600
Net Income: $33,800 – $9,598 – $1,600 = $22,602
Net Yield: $22,602 ÷ $850,000 × 100 = 2.66%
That’s the real number. Your $850,000 asset generates 2.66% net return before tax and before mortgage costs. If your mortgage interest rate is 6.5%, you’re losing 3.84% annually on the asset itself. Capital appreciation is the only thing keeping this investment viable.
Why This Matters
Most Auckland landlords don’t calculate net yield. They look at gross yield (3.98% in this example) and think the property is performing. But operating expenses and capital expenditure consume 1.32% of that yield. The actual cash-generating capacity is 33% lower than the headline number.
If you’re using gross yield to evaluate property performance, you’re measuring the wrong thing. Net yield is what pays the bills. This is what we track for every property under management, and it’s the number that determines whether your 10-year capital expenditure plan is affordable or whether you’re slowly running out of capital.
Metric 2: Tenant Retention Rate
This metric is invisible to most landlords. It doesn’t appear in any standard property report. But it’s one of the most powerful predictors of actual returns.
Why Tenant Retention Matters
Every time a tenant leaves, you lose money in four ways:
- Letting fees: One week’s rent (typically $650-750 in Auckland)
- Vacancy: Average 2-3 weeks between tenants ($1,300-1,950 lost rent)
- Make-good costs: Cleaning, minor repairs, touch-up paint ($400-800)
- Administrative overhead: Time coordinating viewings, processing applications
Total cost per tenant change: $2,650-3,500
If your tenants stay an average of two years, you’re paying $1,325-1,750 annually in tenant turnover costs. That’s 0.16-0.21% of your property value disappearing purely from churn.
Calculating Your Retention Rate
Tenant Retention Rate = Average Tenancy Length in the last 5 years
What Good Looks Like in Auckland:
- Excellent: 3+ years average tenancy
- Good: 2-3 years average tenancy
- Poor: 12-18 months average tenancy
- Problem: Under 12 months average tenancy
A Real Example
Property A (Silverdale townhouse): Three tenants in six years. Average tenancy: 2 years. Turnover cost over six years: approximately $7,500.
Property B (Orewa unit): Six tenants in six years. Average tenancy: 1 year. Turnover cost over six years: approximately $18,000.
Property B lost an extra $10,500 purely from tenant churn. That’s 1.24% of the property value consumed by turnover. This is a direct hit to net yield that most landlords never calculate because it’s spread across multiple line items (letting fees, vacancy, maintenance) and never aggregated.
What Drives Retention
In Auckland’s current market, tenant retention is influenced by three factors: property quality (Healthy Homes compliance, functional amenities, low maintenance issues), professional management (consistent communication, fast maintenance response, fair treatment), and market positioning (rent priced appropriately for condition and location).
This is why we track tenant retention as a core performance metric. A property with 95% occupancy and three-year average tenancy will outperform a property with 98% occupancy and one-year average tenancy, even though the occupancy rate looks worse on paper.
Metric 3: Lifecycle Cost Ratio
Most landlords think about maintenance costs in annual terms. “I spent $1,200 on maintenance this year, that’s reasonable.” But property expenses aren’t annual. They’re cyclical. The hot water cylinder lasts 12 years. The roof lasts 25 years. Carpet lasts 7-10 years. Paint lasts 10 years.
If you’re only tracking annual expenses, you’re systematically underestimating the true cost of ownership.
The Lifecycle Cost Ratio: Total 10-Year Cost as % of Property Value
This metric forces you to look at the complete cost picture over a full property lifecycle.
Formula:
Lifecycle Cost Ratio = (10-Year OpEx + 10-Year CapEx) / Current Property Value × 100
Example Calculation for $850,000 Auckland Property:
10-Year Operating Expenses:
- Rates (average $3,200/year, inflating 4% annually): $38,000
- Insurance (average $1,800/year, inflating 6% annually): $23,600
- Property management (8.5% of rent): $28,730
- Inspections ($200/year): $2,000
- Letting fees (5 changes @ $650): $3,250
- Routine maintenance ($1,200/year average): $12,000
- Total 10-Year OpEx: $107,580
10-Year Capital Expenditure:
- Carpet replacement (Year 7): $3,500
- Exterior paint (Year 8): $8,000
- Hot water cylinder (Year 10): $2,400
- Heat pump replacement (Year 9): $3,200
- Appliance replacements (oven, rangehood): $2,000
- Fence/gate repairs: $1,500
- Minor renovations/updates: $4,000
- Total 10-Year CapEx: $24,600
Total 10-Year Cost: $107,580 + $24,600 = $132,180
Lifecycle Cost Ratio: $132,180 ÷ $850,000 × 100 = 15.55%
This property will consume 15.55% of its current value in operating costs and capital expenditure over the next decade. That’s the real cost of ownership.
Why This Number Is Powerful
The Lifecycle Cost Ratio tells you two things immediately:
- Affordability: Can your rental income cover 15.55% of property value over 10 years? If annual rent is $33,800, your 10-year rental income is $338,000. After $132,180 in costs, you have $205,820 left for mortgage payments and profit. Does that work with your loan structure?
- Asset Quality: A property with a 20% Lifecycle Cost Ratio is more expensive to own than a property with a 12% ratio. This is often invisible in year one but becomes obvious over time.
This is why we create a 10-year capital expenditure plan for every property. Without it, landlords are flying blind. They don’t know whether their asset is affordable to hold over time, and they make decisions based on a single year’s expenses that don’t reflect the true cost structure.
Metric 4: Compliance Risk Score
This metric doesn’t appear in any standard property report, but it should. Compliance failures can cost you thousands in fines, legal fees, and remediation. They can also destroy tenant retention, trigger insurance exclusions, and expose you to liability.
What Is the Compliance Risk Score?
The Compliance Risk Score assesses your property against five critical compliance areas: Healthy Homes Standards, Residential Tenancies Act obligations, Insurance policy conditions, Building Code safety requirements, and Council bylaws and consents.
Each area is scored as Pass (0 points), At Risk (1 point), or Non-Compliant (3 points). Your total score determines your risk exposure.
Compliance Risk Score Calculation:
1. Healthy Homes Standards (0-3 points)
- 0 points: All six standards met (heating, insulation, ventilation, moisture, draught stopping, drainage)
- 1 point: One minor issue (e.g., heat pump needs service, extractor fan marginal)
- 3 points: Major non-compliance (no fixed heating, insufficient insulation, serious moisture issues)
2. Residential Tenancies Act (0-3 points)
- 0 points: Compliant tenancy agreement, bond lodged correctly, all notices properly served
- 1 point: Minor administrative issues (late rent increase notice, unsigned amendment)
- 3 points: Major violations (unlawful entry, bond not lodged, illegal lease terms)
3. Insurance Policy Conditions (0-3 points)
- 0 points: Property meets all policy conditions, regular maintenance documented
- 1 point: Minor maintenance gaps (gutters due for cleaning, no recent plumbing check)
- 3 points: Policy exclusion triggers (gradual damage not monitored, structural issues ignored)
4. Building Code Safety (0-3 points)
- 0 points: Smoke alarms compliant, deck railings secure, electrical safety verified
- 1 point: Minor safety issues (one expired smoke alarm, loose handrail)
- 3 points: Serious hazards (non-compliant smoke alarms, unsafe deck, electrical faults)
5. Council Bylaws (0-3 points)
- 0 points: All consents current, no outstanding notices, compliant modifications
- 1 point: Minor issues (weatherboard needs painting, fence height marginal)
- 3 points: Unconsented work, outstanding notices, serious code violations
Your Total Risk Score:
- 0-2 points: Low Risk (Well-managed asset)
- 3-5 points: Moderate Risk (Action required within 6 months)
- 6-9 points: High Risk (Immediate action required)
- 10+ points: Critical Risk (Significant liability exposure)
Why This Matters
A property with a Compliance Risk Score of 8 is a lawsuit waiting to happen. A score of 1-2 means you’re protected against the most common landlord liabilities in Auckland’s current regulatory environment.
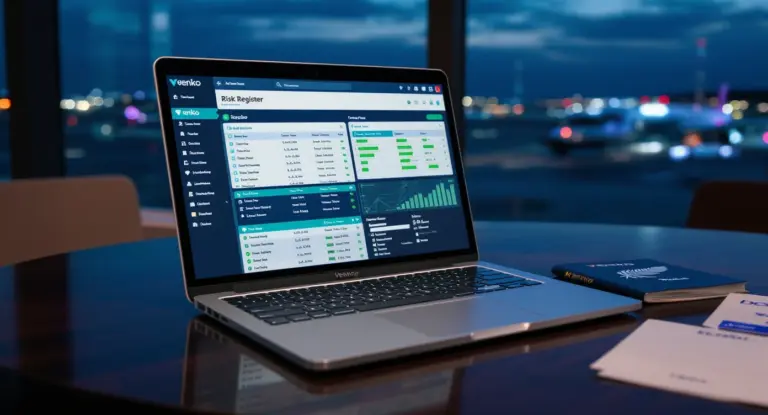
We assess every property’s Compliance Risk Score as part of our Risk Register inspection process. This isn’t about ticking boxes. It’s about understanding your actual exposure and prioritising remediation based on liability, not convenience.
Compliance Note: The Compliance Risk Score is a framework for assessing liability exposure. Actual legal requirements should be verified with a property lawyer or licensed property manager.
Metric 5: 10-Year Internal Rate of Return (IRR)
Most landlords calculate return as: (Property Value Today – Purchase Price) / Purchase Price. This is wrong for two reasons.
First, it ignores the time value of money. A 20% gain over two years is very different from 20% over ten years. Second, it ignores cashflow during the holding period. A property that requires $50,000 in capital injections to stay afloat should not be evaluated the same as one that generates $50,000 in surplus cash.
What Is IRR?
Internal Rate of Return (IRR) is the compound annual return that accounts for all cashflows over the entire holding period: initial deposit, ongoing cashflow (positive or negative), capital expenditure, and final sale proceeds.
IRR answers the question: “What annual return am I actually earning on the capital I’ve deployed in this asset?”
Example IRR Calculation
You buy an Auckland property in 2016 for $650,000 with a 20% deposit ($130,000). Over 10 years:
Year 0: $130,000 deposit (outflow)
Years 1-10 Cashflow (Annual):
- Rent: $30,000 (Year 1) inflating 3% annually
- Mortgage interest (interest-only loan): $26,000 (Year 1) at 6.5%
- Operating expenses: $8,500 (Year 1) inflating 4% annually
- Capital expenditure: $1,500 (Year 1) inflating 3% annually
Annual Cashflow: Rent – Interest – OpEx – CapEx = Net Cashflow (varies by year)
Year 10: Sell property for $850,000, pay off $520,000 loan, receive $330,000 (inflow)
IRR Calculation: Find the discount rate that makes the net present value of all cashflows equal zero.
In this example, the 10-year IRR is approximately 6.2% per annum. That’s your actual compound return on the $130,000 you deployed in 2016, after accounting for negative cashflow years, capital expenditure, and the final sale.
Note: IRR calculations are estimates based on assumed inflation rates and cashflows. Actual returns will vary based on market conditions, maintenance costs, and rental growth.
Why IRR Matters
A property with 30% capital appreciation over 10 years sounds impressive. But if it required $40,000 in capital injections during that period, and you started with a $130,000 deposit, your IRR might only be 4%. That’s the actual return on your capital.
IRR forces you to evaluate properties the way a commercial investor would: as a cashflow-generating (or cashflow-consuming) asset over time, not just as a capital appreciation play. It’s the metric that determines whether you’re genuinely building wealth or whether your property is an expensive store of value with mediocre returns.
Metric 6: Actual Cashflow (Not “Positive” or “Negative”)
Cashflow positive is a myth. It’s a binary label that tells you almost nothing about property performance. A property that’s cashflow positive by $10 per week is not meaningfully different from one that’s cashflow negative by $10 per week. Both are barely breaking even.
What matters is the actual cashflow number, and more importantly, whether that number is sustainable and predictable.
True Cashflow Formula (After-Tax, Post-Principal)
True Cashflow = Rent – Mortgage (Interest + Principal) – OpEx – CapEx – Tax
This is the number that hits your bank account. Not the Instagram-friendly “cashflow positive” label. The actual dollar figure after all costs, including principal repayment and tax.
Example Calculation
Annual Rent: $33,800
Mortgage Payment (P&I loan):
- Loan amount: $680,000
- Interest rate: 6.5%
- 30-year term
- Annual payment: $51,650 (Interest: $44,200, Principal: $7,450)
Operating Expenses: $9,598
Capital Expenditure (Annualised): $1,600
Pre-Tax Cashflow: $33,800 – $51,650 – $9,598 – $1,600 = -$29,048 (annual deficit)
Tax Position:
- Interest deductible (if new build): $44,200
- Other deductible expenses: $11,198
- Total deductions: $55,398
- Rental income: $33,800
- Taxable loss: $21,598
If you’re in the 33% tax bracket and earning $120,000 from other sources, this loss saves you approximately $7,127 in tax.
Tax Note: These calculations are illustrative and assume a 33% marginal tax rate. Interest deductibility rules depend on property purchase date and type (new builds have full deductibility; existing properties have phased rules). Consult your accountant for your specific tax position.
After-Tax Cashflow: -$29,048 + $7,127 = -$21,921 per year or -$422 per week
That’s your true cashflow. This property costs you $422 per week to hold, after tax benefits. That’s the number that matters. Not whether it’s “positive” or “negative,” but whether you can afford that $422 per week outflow and whether the long-term capital appreciation justifies it.
Why Actual Cashflow Matters More Than the Label
Two properties can both be “cashflow negative,” but one costs $100 per week and the other costs $500 per week. These are completely different investment profiles. The $100 property might be sustainable for a decade. The $500 property might force a sale in two years if your income changes.
This is why we calculate true after-tax cashflow for every property. It’s the only way to know whether the investment is genuinely affordable over the long term, and it’s the number that determines how much capital reserve you need to hold the asset through market cycles.
How These Six Metrics Work Together
These metrics aren’t independent. They interact. A property with poor tenant retention (Metric 2) will have higher lifecycle costs (Metric 3) due to increased turnover expenses. A property with a high Compliance Risk Score (Metric 4) will eventually face remediation costs that reduce net yield (Metric 1) and worsen cashflow (Metric 6).
The Performance Dashboard
If you tracked all six metrics for an $850,000 Auckland property, your dashboard might look like this:
- Net Yield: 2.66% (after all OpEx and CapEx)
- Tenant Retention Rate: 2.5 years average tenancy
- Lifecycle Cost Ratio: 15.55% (10-year cost as % of property value)
- Compliance Risk Score: 2 points (low risk)
- 10-Year IRR: 6.2% per annum
- Actual Cashflow: -$422 per week after tax
This dashboard tells you immediately:
- The property generates 2.66% net yield before leverage
- Tenants stay long enough that turnover isn’t destroying returns
- Over 10 years, operating and capital costs will consume 15.55% of property value
- Compliance risk is low (no major liability exposure)
- Your actual compound return on deployed capital is 6.2% annually
- You need $422 per week to hold this asset after tax benefits
Now you can make informed decisions. Is 6.2% IRR acceptable for the risk and illiquidity of property investment? Can you afford $422 per week long-term? Is 2.66% net yield sufficient if capital appreciation slows?
These are the right questions. “Is it cashflow positive?” is not.
What to Do With These Numbers
Tracking metrics is pointless if you don’t act on them. Here’s how to use each metric to improve property performance.
1. If Net Yield Is Below 2%:
- Review property management fees and maintenance markups (zero markup saves 0.1-0.15% yield annually)
- Reduce vacancy time through faster tenant placement (every week of vacancy costs 0.08% net yield)
- Improve energy efficiency to reduce insurance premiums and tenant complaints
2. If Tenant Retention Is Below 2 Years:
- Review rent positioning (too high for condition drives turnover)
- Address maintenance issues faster (slow responses drive tenant departures)
- Improve property condition (Healthy Homes compliance baseline, consider upgrades)
3. If Lifecycle Cost Ratio Is Above 18%:
- Your property is expensive to own relative to its value
- Consider targeted upgrades to reduce ongoing maintenance (new roof, repaint exterior)
- Evaluate whether holding costs justify keeping the asset
4. If Compliance Risk Score Is Above 5:
- Prioritise remediation based on liability exposure (insurance exclusions first, then safety hazards)
- Create a 6-month compliance roadmap with specific deadlines
- Budget for remediation costs (don’t treat them as discretionary)
5. If 10-Year IRR Is Below 5%:
- Your capital is earning less than many low-risk alternatives
- Evaluate whether capital appreciation expectations justify the IRR
- Consider whether selling and redeploying capital makes sense
6. If Actual Cashflow Requires >$500/Week Top-Up:
- This property is consuming significant capital annually
- Evaluate whether your income can sustain this long-term
- Consider principal-only loan restructure or partial sale to reduce debt
The Auckland Market Context: Why These Metrics Matter Now
Auckland’s property market in 2026 is fundamentally different from 2016. Interest rates have normalised at 6-7%. Insurance costs are rising 10-15% annually. Compliance requirements are stricter. Capital appreciation has slowed in many suburbs.
In this environment, landlords who don’t track the right metrics are operating blind. A property that “worked” in 2019 because 2.8% interest rates covered weak fundamentals no longer works at 6.5% interest. A property that was “fine” with minimal maintenance now faces $7,200 Tenancy Tribunal fines for Healthy Homes non-compliance.
The New Reality
Auckland landlords in 2026 need to think like commercial property investors. That means tracking net yield, lifecycle costs, and compliance risk. It means understanding IRR and actual cashflow, not just capital appreciation. It means running properties like business assets, not like hobbies.
This isn’t about being cold or clinical. It’s about being competent. Your $850,000 Auckland rental property is your second-largest asset after your home. It deserves better than “I think it’s doing okay” based on a single year’s gross yield.
Tools and Systems for Tracking Performance
Most landlords don’t track these metrics because they don’t have systems for it. They rely on annual tax statements and ad-hoc maintenance invoices, then wonder why they can’t answer basic questions about property performance.
What You Need
- A complete cost register: Every expense categorised (rates, insurance, management fees, maintenance, CapEx)
- A 10-year CapEx forecast: Major replacement cycles with estimated costs
- A compliance tracking system: Annual review of Healthy Homes, RTA obligations, insurance conditions
- A tenant history log: Move-in dates, move-out dates, vacancy periods, reason for departure
- A performance dashboard: The six metrics updated annually
This sounds complex, but it’s not. It’s just systematic record-keeping. We build this for every property under management because it’s the only way to answer the question that matters: “Is this asset actually performing?”
The Bottom Line
Most Auckland landlords measure property performance with one or two metrics: gross yield and capital appreciation. Both are incomplete. Gross yield ignores costs. Capital appreciation ignores cashflow during the holding period.
If you track six metrics instead of two, you’ll have a complete picture of property performance: Net yield (after all costs), tenant retention rate (cost of churn), lifecycle cost ratio (10-year cost as % of value), compliance risk score (liability exposure), 10-year IRR (true return on capital), and actual cashflow (after tax and principal).
These metrics work together. A property with 2.8% net yield, three-year tenant retention, 14% lifecycle cost ratio, low compliance risk, 6.5% IRR, and -$350/week after-tax cashflow is a completely different investment from a property with 2.2% net yield, one-year tenant retention, 19% lifecycle cost ratio, high compliance risk, 4.2% IRR, and -$550/week cashflow.
The first property is performing. The second is slowly consuming capital.
The decision is yours. You can keep tracking gross yield and hoping for the best. Or you can track the metrics that predict actual returns and make informed decisions about whether your Auckland rental property is genuinely building wealth or just looking good on paper.
About Venko Property
We track all six metrics for every property under systematic property management. Net yield, tenant retention, lifecycle costs, compliance risk, IRR projections, and after-tax cashflow. Not because we’re obsessed with spreadsheets, but because these are the numbers that determine whether your asset is performing.
Based in Hibiscus Coast and serving Auckland’s North Shore to Warkworth, we bring project management discipline to residential property. Transparent pricing, zero maintenance markup, Risk Register inspections, and 10-year capital expenditure planning. Your property managed like the commercial asset it is, not like a side hustle.
Want to know what your property’s actual performance metrics look like? Contact us for a straightforward assessment of net yield, lifecycle costs, and compliance risk score.
Looking to exit your property management business or sell your rent roll? Contact us directly to discuss acquisition opportunities in the Auckland region.
Disclaimer
This article provides general educational information only and is not financial, tax, legal, or professional advice. Property management regulations, compliance requirements, and market conditions vary by location and change frequently.
Always consult qualified, licensed professionals (financial advisers, accountants, solicitors, or real estate agents) before making property investment or management decisions. Venko Property Limited is a residential property management company and does not provide licensed advisory services.
Examples and figures reflect general market conditions at the time of writing and may not apply to your specific situation.